The 20 YouTube KPIs That Measure Your Channel’s Growth

In order to grow your YouTube channel, it’s important to take an objective, data-based approach. This means monitoring and analyzing the key data points that track your channel’s success. In this article, we explain how YouTube KPIs work and which ones are worth tracking.
What is a KPI?
A key performance indicator (KPI) is a quantifiable metric used to evaluate the success of a project, organization, or person in achieving specific objectives. KPIs provide measurable insights into performance, which helps you assess your progress and make informed decisions.
For instance, many businesses use revenue as a KPI because it represents the health of the business. If revenue goes up, things are clearly going well. If revenue falls, some changes might be in order.
What are YouTube KPIs?
A YouTube KPI is – quite simply – a KPI that applies to your YouTube channel or video. You can use your KPIs to monitor the growth and success of your channel. You can find them tracked in your YouTube analytics dashboard.
Where to Find Your YouTube KPIs
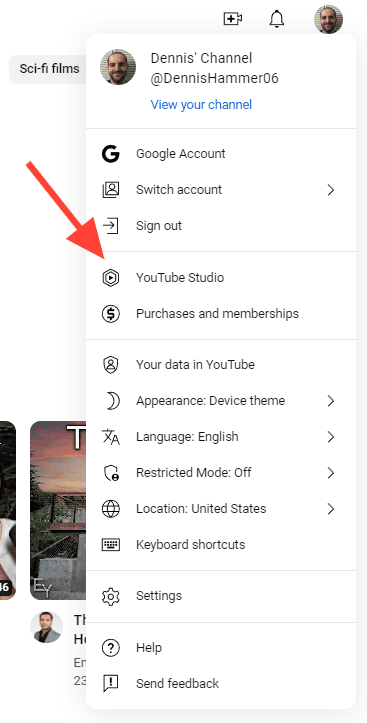
On the desktop, open YouTube in your browser and sign into the Google account through which you manage your YouTube channel. Click your circular profile picture and select “YouTube Studio.”
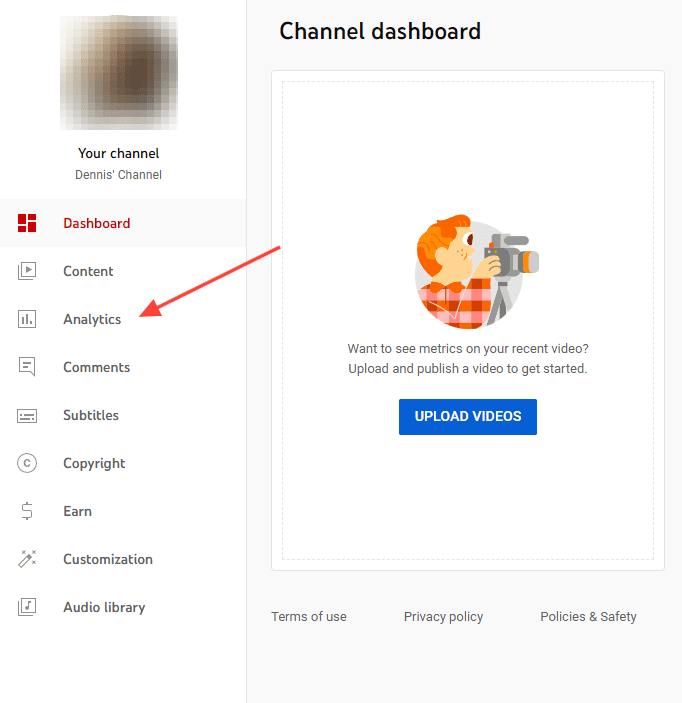
In YouTube Studio, you’ll see a left-side panel with options to manage your content. Click “Analytics” to open the analytics dashboard.
Use the tabs across the top to access different panels of the analytics dashboard.
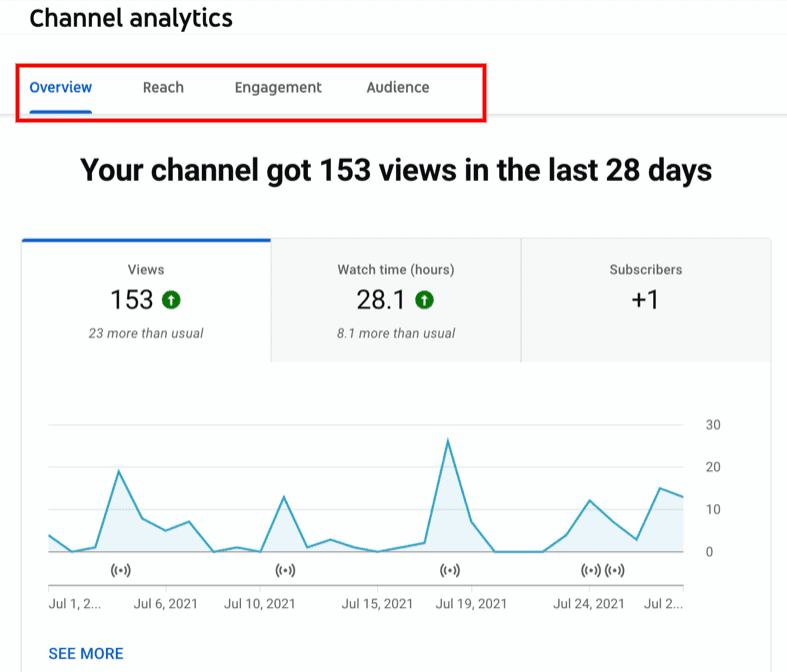
Adjust the date selector to view your metrics in different time periods.
If you want to get real granularity, click the “Advanced Mode” link in the top right corner. This will open up a window with a more detailed version of YouTUbe analytics. It also allows you to create comparisons across your metrics and even design your own charts.
You can also find the same information in the YouTube Studio mobile app. The regular YouTube app does not have analytics information.
The 20 YouTube KPIs You Should Be Tracking
Let’s go through the most important YouTube KPIs that can have a real impact on your content.
1. Subscribers
Subscribers represent the number of users who have chosen to follow your channel for regular updates. A growing subscriber count reflects sustained interest, loyalty, and potential reach for future content.
Learn more about capturing subscribers in our YouTube channel growth guide.
2. Total Watch Time
Total watch time measures the combined minutes viewers spend watching your content. It’s a crucial indicator of engagement and can influence the visibility of your videos.
Higher total watch time enhances your video and channel’s standing on the platform, potentially leading to increased exposure through recommendations. Focus on creating captivating content to boost this metric and strengthen your overall presence on YouTube.
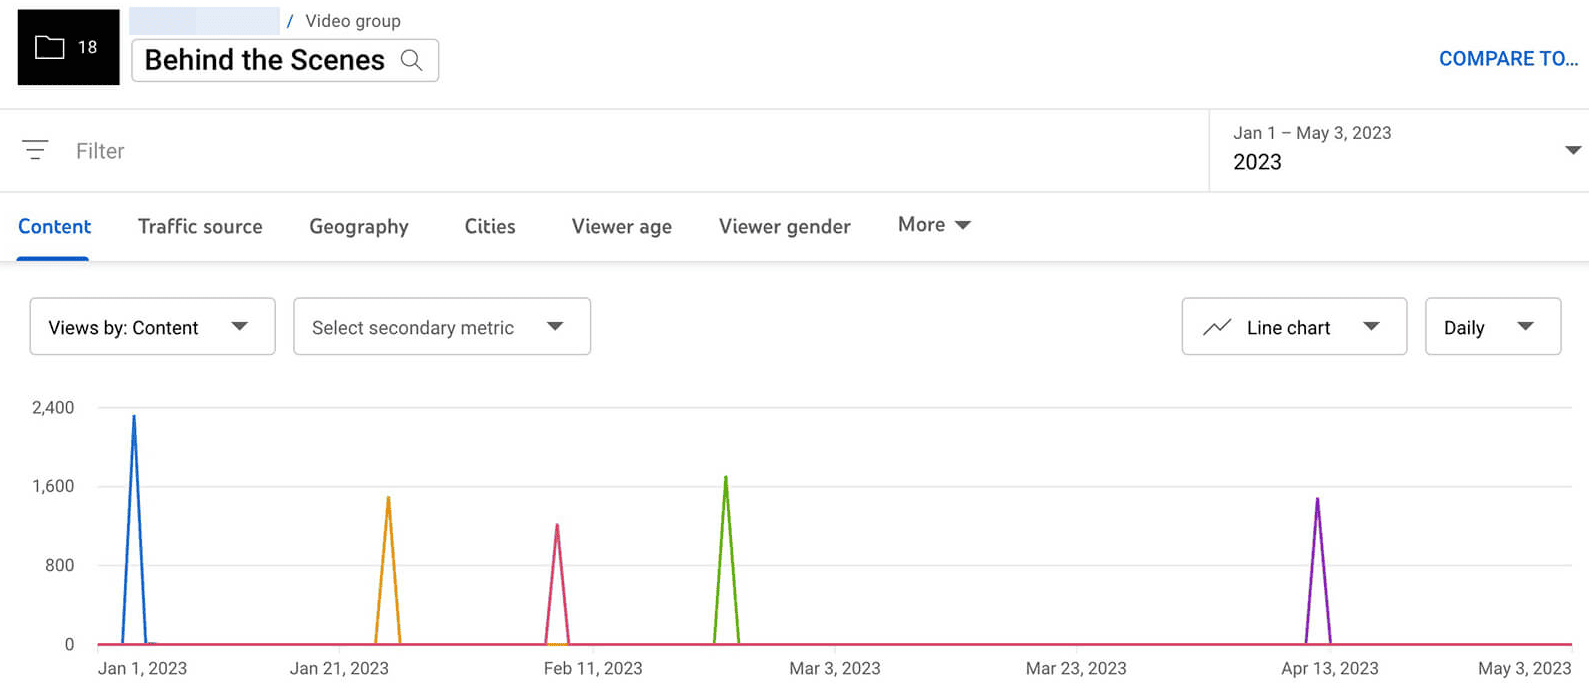
3. Most Popular Videos
This technically isn’t a metric, but it’s a valuable way to identify the content that receives the highest number of views, showcasing your top-performing videos. Analyze these videos to understand your audience’s preferences and what makes successful content. Use the insights gained from these popular videos to inform your content creation.
4. Views
Views represent the number of times your video has been watched. This metric gauges audience interest and is vital for assessing content performance.
More views indicate broader reach and popularity. If your views are going up, you are on the right track. Use this metric to understand viewer engagement, optimize your content strategy, and tailor future uploads to capture and retain your audience’s attention.
5. Unique Viewers
The unique viewers metric measures the distinct individuals who have watched your video. Basically, it’s a good way to account for repeat views by the same person and measure the number of actual people who watched your video.
For instance, a video might have 5,000 views, but 4,200 unique viewers. This means 800 views came from the same pool of viewers watching it multiple times.
This is an important YouTube KPI that helps you understand if your audience is growing. If you aren’t seeing many unique viewers, it means you aren’t reaching people outside of your existing audience.
6. Returning Viewers
Returning viewers refers to users who come back to your channel to watch more content. This metric highlights audience loyalty and recurring interest. Monitoring returning viewers helps gauge the strength of your community and tailor content to maintain and grow a dedicated fan base on the platform.
7. Traffic Sources
Traffic sources refer to the origins of viewers who discover and watch your videos. It categorizes how users find your content, such as through YouTube search, external websites, or suggested videos. Analyzing traffic sources helps you understand audience behavior and focus on channels driving the most views.
8. Audience Retention
Audience retention measures the percentage of viewers who continue watching your video over time. It provides insights into content engagement and helps identify points where viewers may drop off. High audience retention indicates compelling content, while dips suggest areas for improvement.
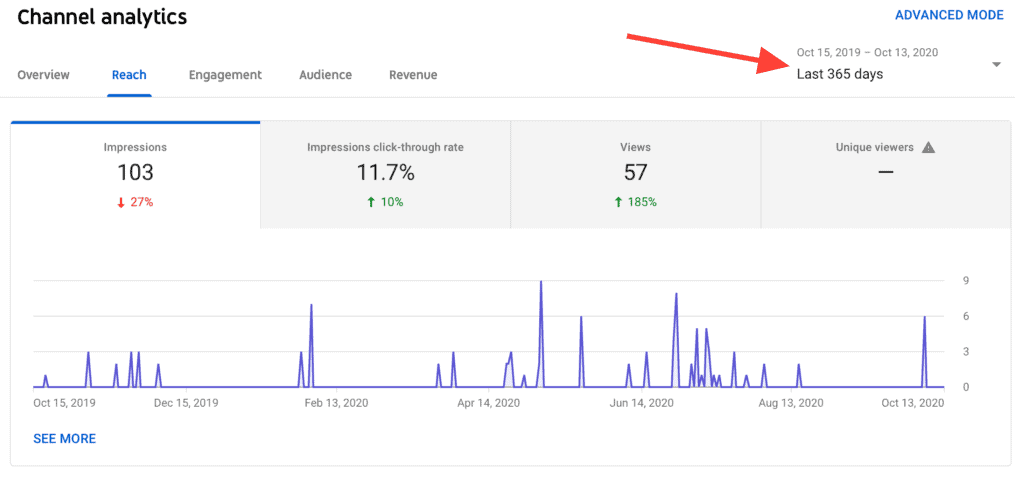
9. Impressions
Impressions represent the number of times your video thumbnail is shown to users on the platform. It measures visibility, but doesn’t guarantee views. High impressions means you have effective distribution or good search optimization. Look at the metadata of your videos with high impressions to identify why they keep appearing in YouTube’s recommendations.
10. Impressions Click-Through Rate
This is the percentage of viewers who clicked on your video after seeing the thumbnail impressions. It gauges the effectiveness of your video’s presentation in attracting clicks.
A higher click-through rate indicates strong viewer interest. Analyzing this metric helps optimize thumbnails, titles, and your overall content promotion strategy to enhance click-through rates.
11. Average Percentage Viewed
Average percentage viewed measures the average portion of a specific video watched by viewers as a percentage. It indicates your audience’s engagement with the content. A higher percentage suggests strong viewer interest, while a lower one means it didn’t keep viewers’ attention. This metric is limited to the top 100 videos.
12. Average View Duration
This is calculated the same way as average percentage viewed, but displayed as a length in minutes and seconds. It’s limited to your top 100 videos.
13. Demographics
In YouTube analytics, demographics refer to information about the characteristics of your audience, such as age, gender, location, and device type. Analyzing demographic data helps you understand your audience and tailor content to specific demographics.
14. Revenue
The revenue report provides information about the earnings generated from your YouTube channel. It includes details on ad revenue, membership revenue (if applicable), and transactions related to YouTube Premium and Super Chat.
This report helps you track your monetization performance, understand the sources of income, and make informed decisions to optimize revenue streams on the platform. This is an important YouTube KPI to track if you have monetized your channel.
15. Shares
Shares indicate how many times viewers have shared your video on external platforms or social media. This metric measures content virality and audience advocacy..
16. User Comment Added
Comments added refers to the number of user-generated comments on a video. This metric measures audience interaction and engagement. If someone takes time to leave a comment, they are highly engaged.
17. Video Likes
Likes represent the number of users who have expressed appreciation for a video by clicking the thumbs-up icon. This metric indicates viewer satisfaction and engagement. Analyzing likes helps you understand audience preferences and so you can create content that resonates positively with their viewers.
18. View Velocity
The number of views your videos get isn’t the only factor YouTube cares about. It also considers the rate at which your videos accumulate views over a specific period. This is called view velocity. High view velocity indicates rapid viewer adoption, suggesting that the video is gaining traction quickly.
19. End Screen Click Rate
End Screen Click Rate represents the percentage of viewers who clicked on one or more elements within the end screen of a video. A higher click rate indicates that a significant portion of the audience interacted with the end screen. This helps you assess the success of your call-to-actions and make any necessary optimizations.
20. Engagement
The engagement metric in YouTube analytics aggregates different user interactions with your content, including likes, comments, shares, and subscriptions. It reflects the depth of viewer involvement and interest in your videos. High engagement means your content is working and you’ll be rewarded by YouTube’s algorithm.
Analyzing these engagement metrics helps you understand what your audience wants and what keeps them engaged with your content. Use it to tailor your content strategy for higher retention and visibility.
Your Favorite YouTube KPIs
We’ve gone through the most important YouTube KPIs that will impact your YouTube channel, but you may have specific metrics that matter more to your business. What YouTube KPIs do you track? Let us know in the comments.
Launch Your Podcast In Minutes
Castos makes launching simple with one-click setup, automatic distribution to all platforms, and professional hosting. No technical skills required.
Start your 14-day free trial