Understanding Your Podcast Analytics To Grow An Audience

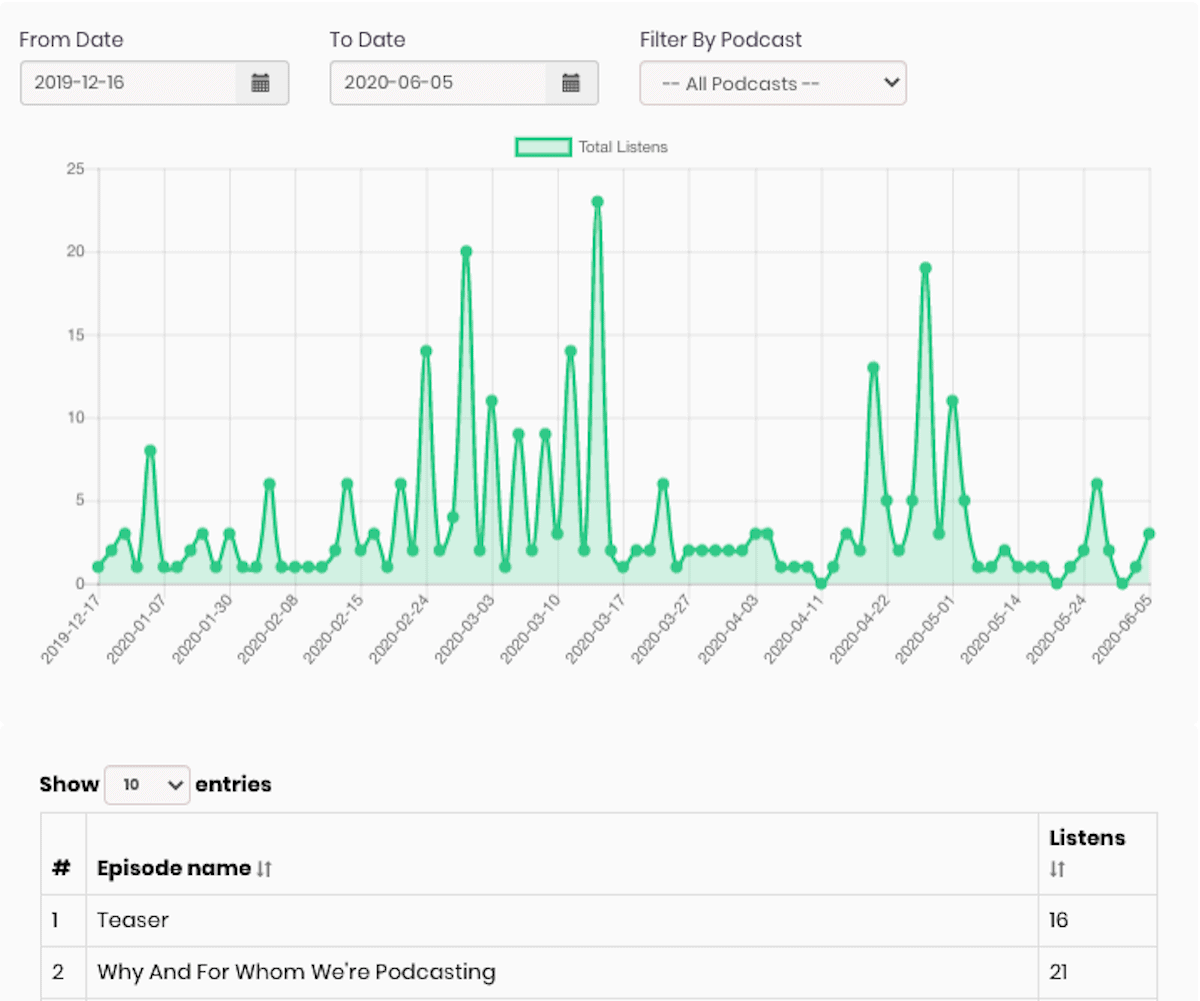
Podcast analytics are the metrics that show how many people listen to your show, who they are, and how they engage. The core numbers are downloads, unique listeners, listening apps and devices, and geographic location. Your podcast host pulls these together into one dashboard so you don’t have to reconcile stats across Apple, Spotify, and every other app by hand.
Podcast analytics are the foundation of big growth decisions. Building an audience, increasing number of downloads, and creating a successful podcast all hinge on understanding the numbers. The data related to high performing episodes and those around listener demographics all provide powerful insights.
But the decentralization of podcasting poses a problem. Podcasters need to look at the aggregate numbers across every listening platform, from Spotify to Pocket Casts, to get a better view into their performance. To remove manual calculations, Castos and many other podcast hosting platforms, created one dashboard to display your data. It’s now easier than before to access a full snapshot an episode in one look.
However, having the numbers pulled together into a single dashboard is just a start. Understanding the analytics and putting their insights to work is how you make better data-backed decisions. If you’re still deciding which dashboard to use in the first place, we compared the tools that track all this separately.
The world of podcast analytics is still in its infancy. And with that comes the need to educate podcasters around how the numbers are calculated and where they come from. Ultimately, the goal is to use your Spotify or Apple podcast analytics to discover new audiences and create more content they’ll love.
In this article, we explain your podcast analytics, where to access the numbers inside Castos, and how to use the data to grow an audience.
Accessing Your Castos Podcast Analytics Dashboard
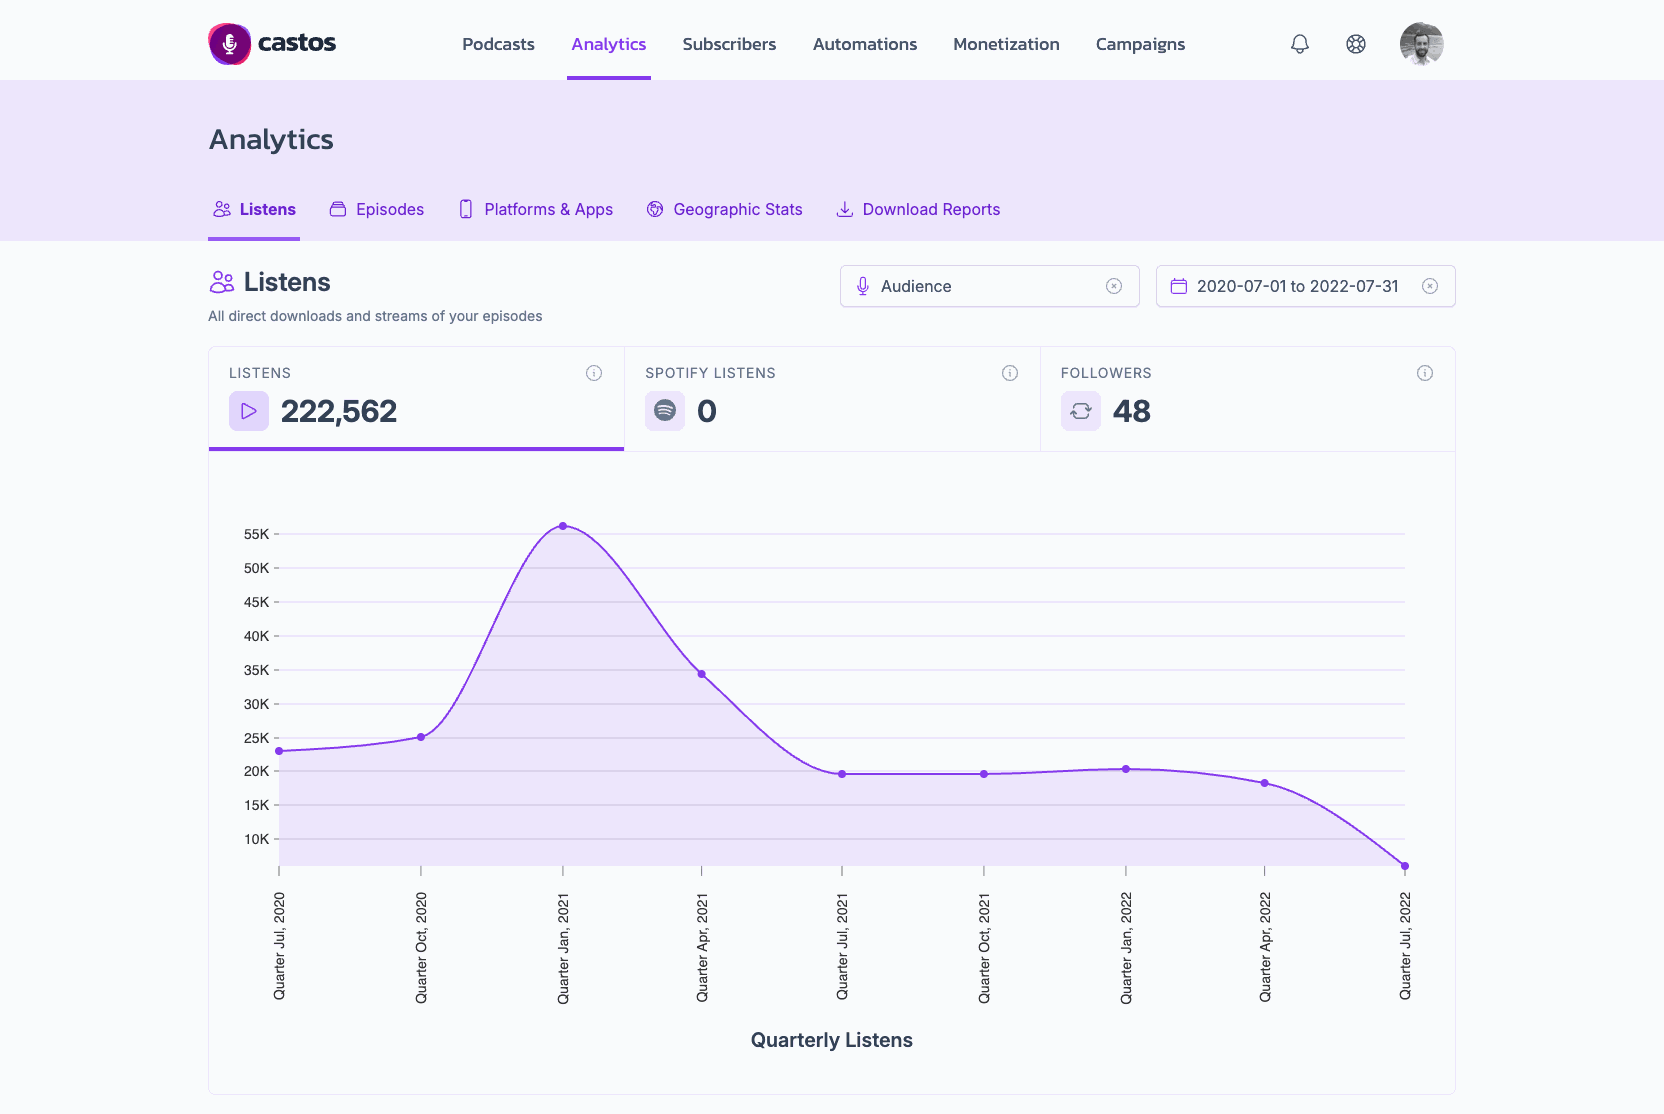
Inside a Castos dashboard, you can access plenty of podcast statistics to learn more about your audience.
To get started, log into your Castos account, and click “Analytics” in the main navigation. The Analytics section is split into five tabs — Listens, Episodes, Platforms & Apps, Geographic Stats, and Download Reports — and from any of them you can filter by podcast (if you host multiple shows) and by date range.
Here’s a breakdown of where to find each data point, what it means, and how it can help you gain followers, more listens, and build a loyal fan base.
Listens
Listens is the default view when you open Analytics, and it’s the best place to check your show’s overall health. Three summary cards sit at the top — Listens (every direct download or stream from your RSS feed), Spotify Listens, and Followers — above a graph plotting listens over your selected date range. In the example above, this podcast logged 222,562 Listens between July 2020 and July 2022.
On the graph, look at the listening data over time for any spikes on particular dates. Use this information to figure out your audience’s listening preferences. Do the majority of listens correspond to the day you release new episodes? Have the total listens remained consistent after making a change to the podcast’s format? Are total listens steadily increasing or decreasing since your launch day?
Episode performance
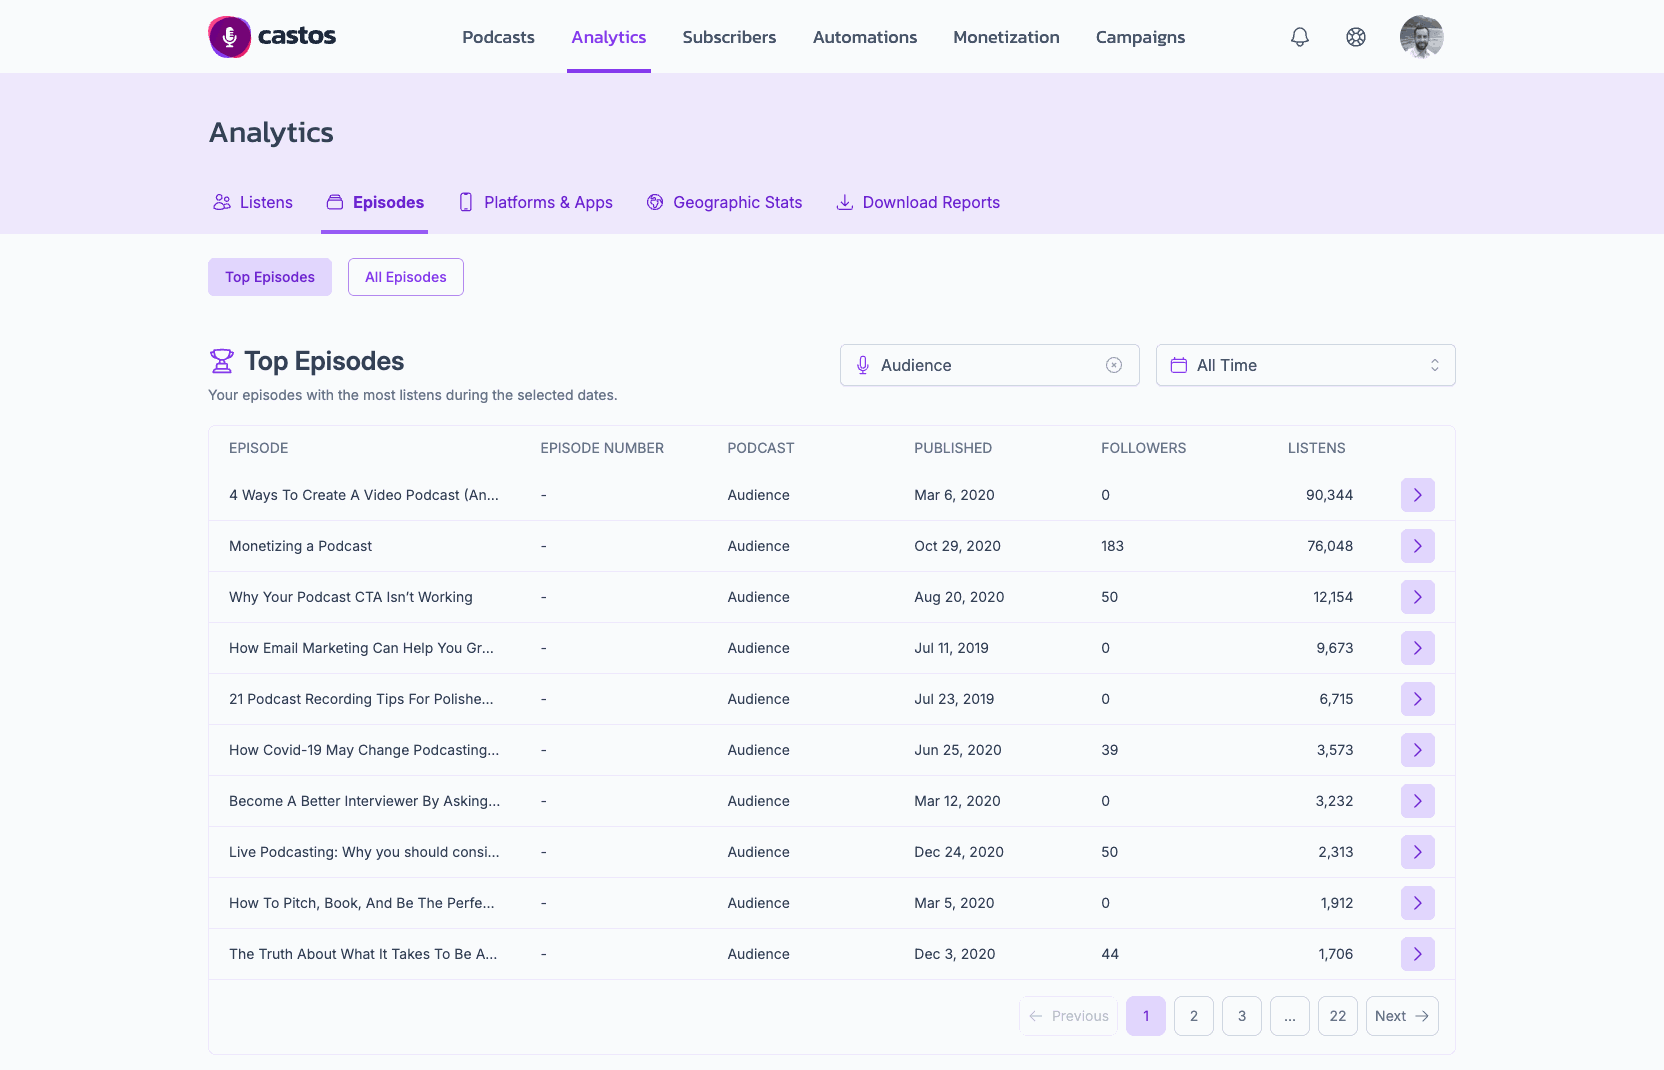
The Episodes tab ranks all your published episodes by listens, toggling between “Top Episodes” and “All Episodes.” The listen count is calculated from the number of times a play button was pressed across every podcast directory where your podcast is listed, and each row also shows the episode’s Followers count and publish date. You can filter by date range, sort by a different column, or search for an episode by name.
This ranking gives you insight into the audience’s listening behavior because it counts a new listen every time someone presses play. Higher listens on an episode could mean people are listening to it more than once, or starting it and finishing later. This metric also helps you make future content decisions. Is your audience engaging more with certain topics compared to others? Are there common threads between the lowest-performing episodes that you can address going forward?
Platforms & apps
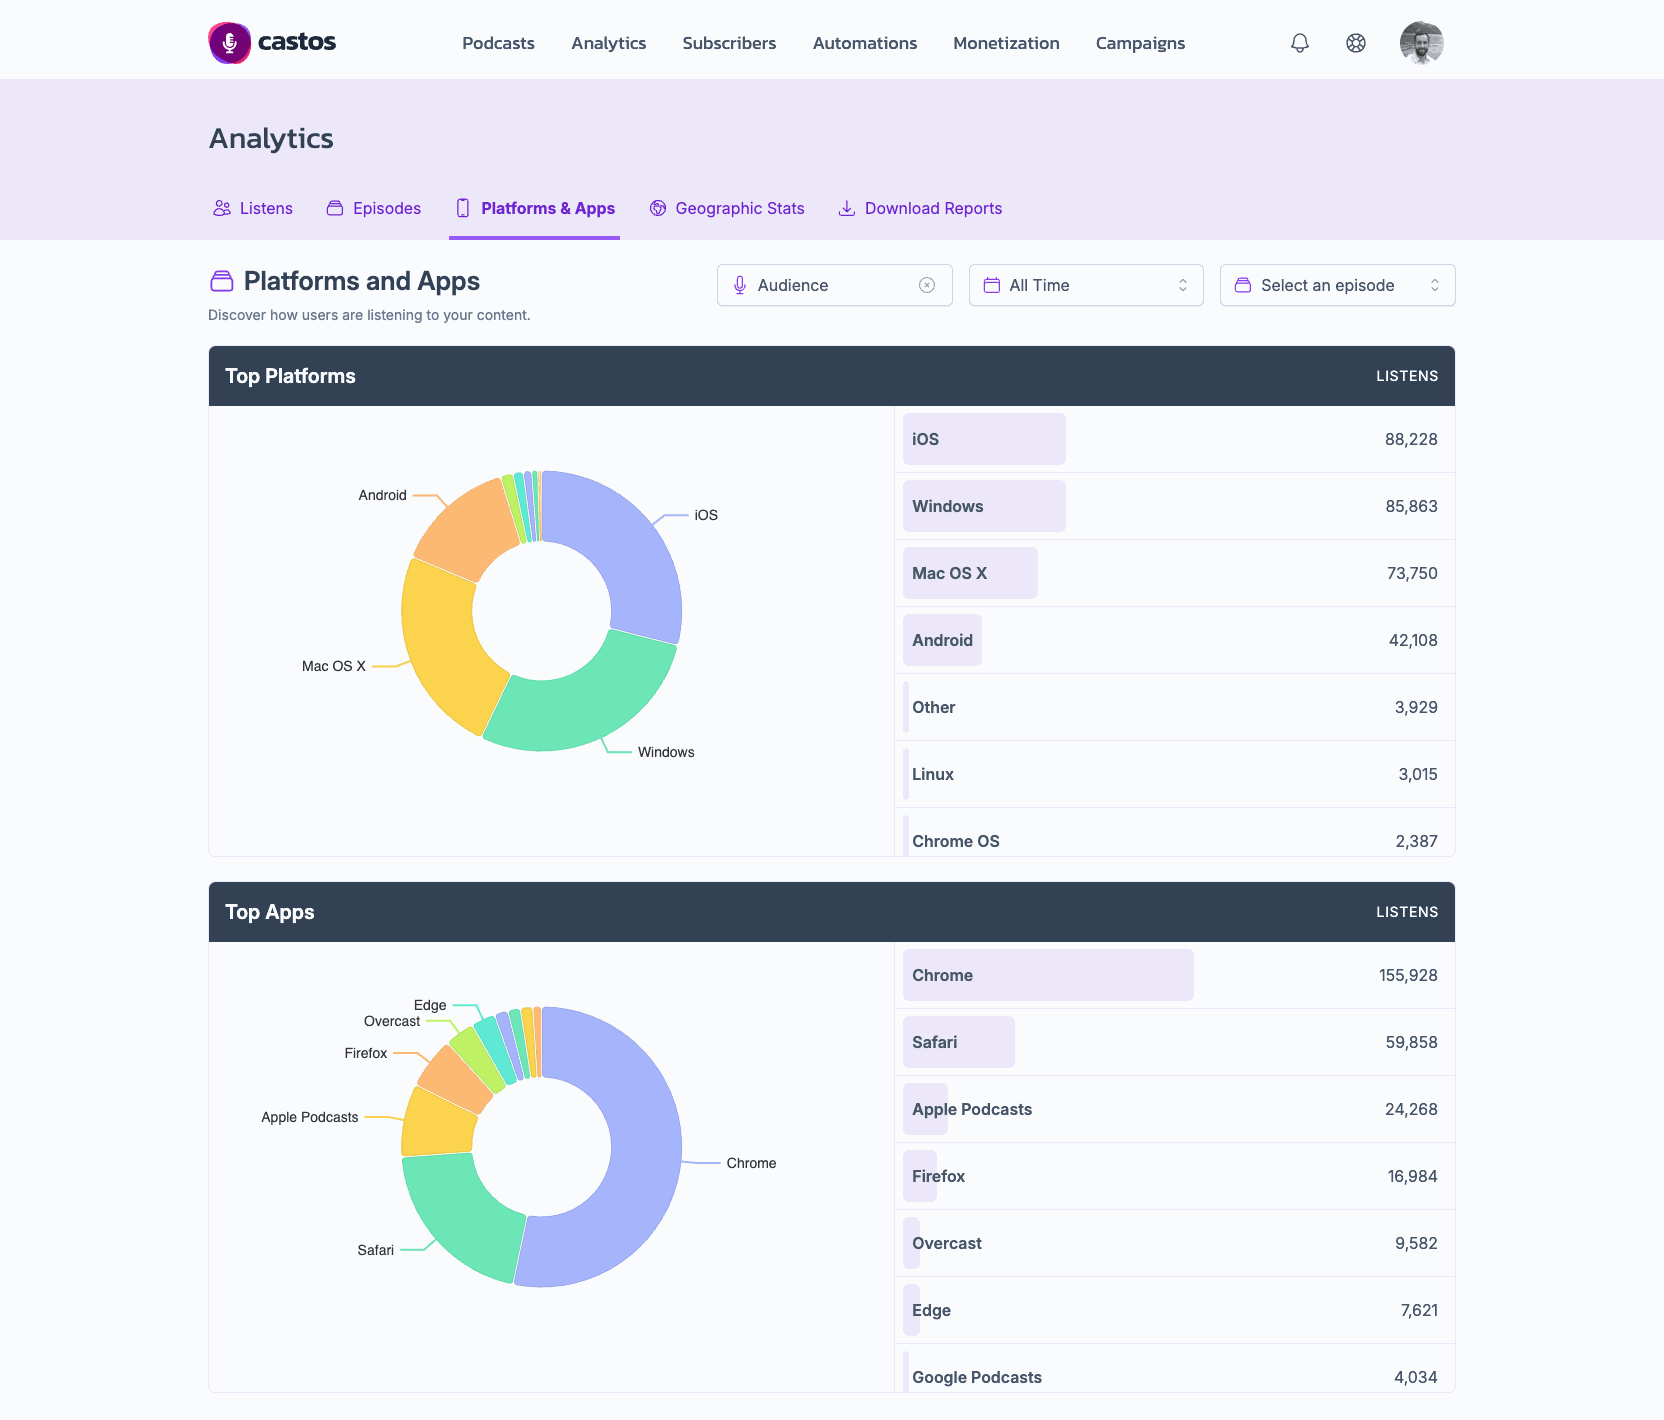
Platforms & Apps is the podcast stat that shows how and where your audience listens. Top Platforms breaks listens down by operating system — iOS, Windows, Mac OS X, Android, and more — and Top Apps breaks them down by the browser or app used, like Chrome, Safari, Apple Podcasts, Firefox, or Overcast. You can filter both by date range, by episode, and by podcast if you host multiple shows.
While it’s important to list a show across as many platforms as possible, use this report to determine which listening platforms and devices your audience prefers. Seeing a lot of listens from Chrome? That means people are going to your website and consuming episodes from the embedded player — is there an opportunity to add transcriptions or other resources to enrich the listening experience? Does the majority of your audience use Android devices? It may make sense to update your call-to-action to list Android-specific apps instead of only promoting a subscribe link to Apple Podcasts.
Spotify podcast analytics
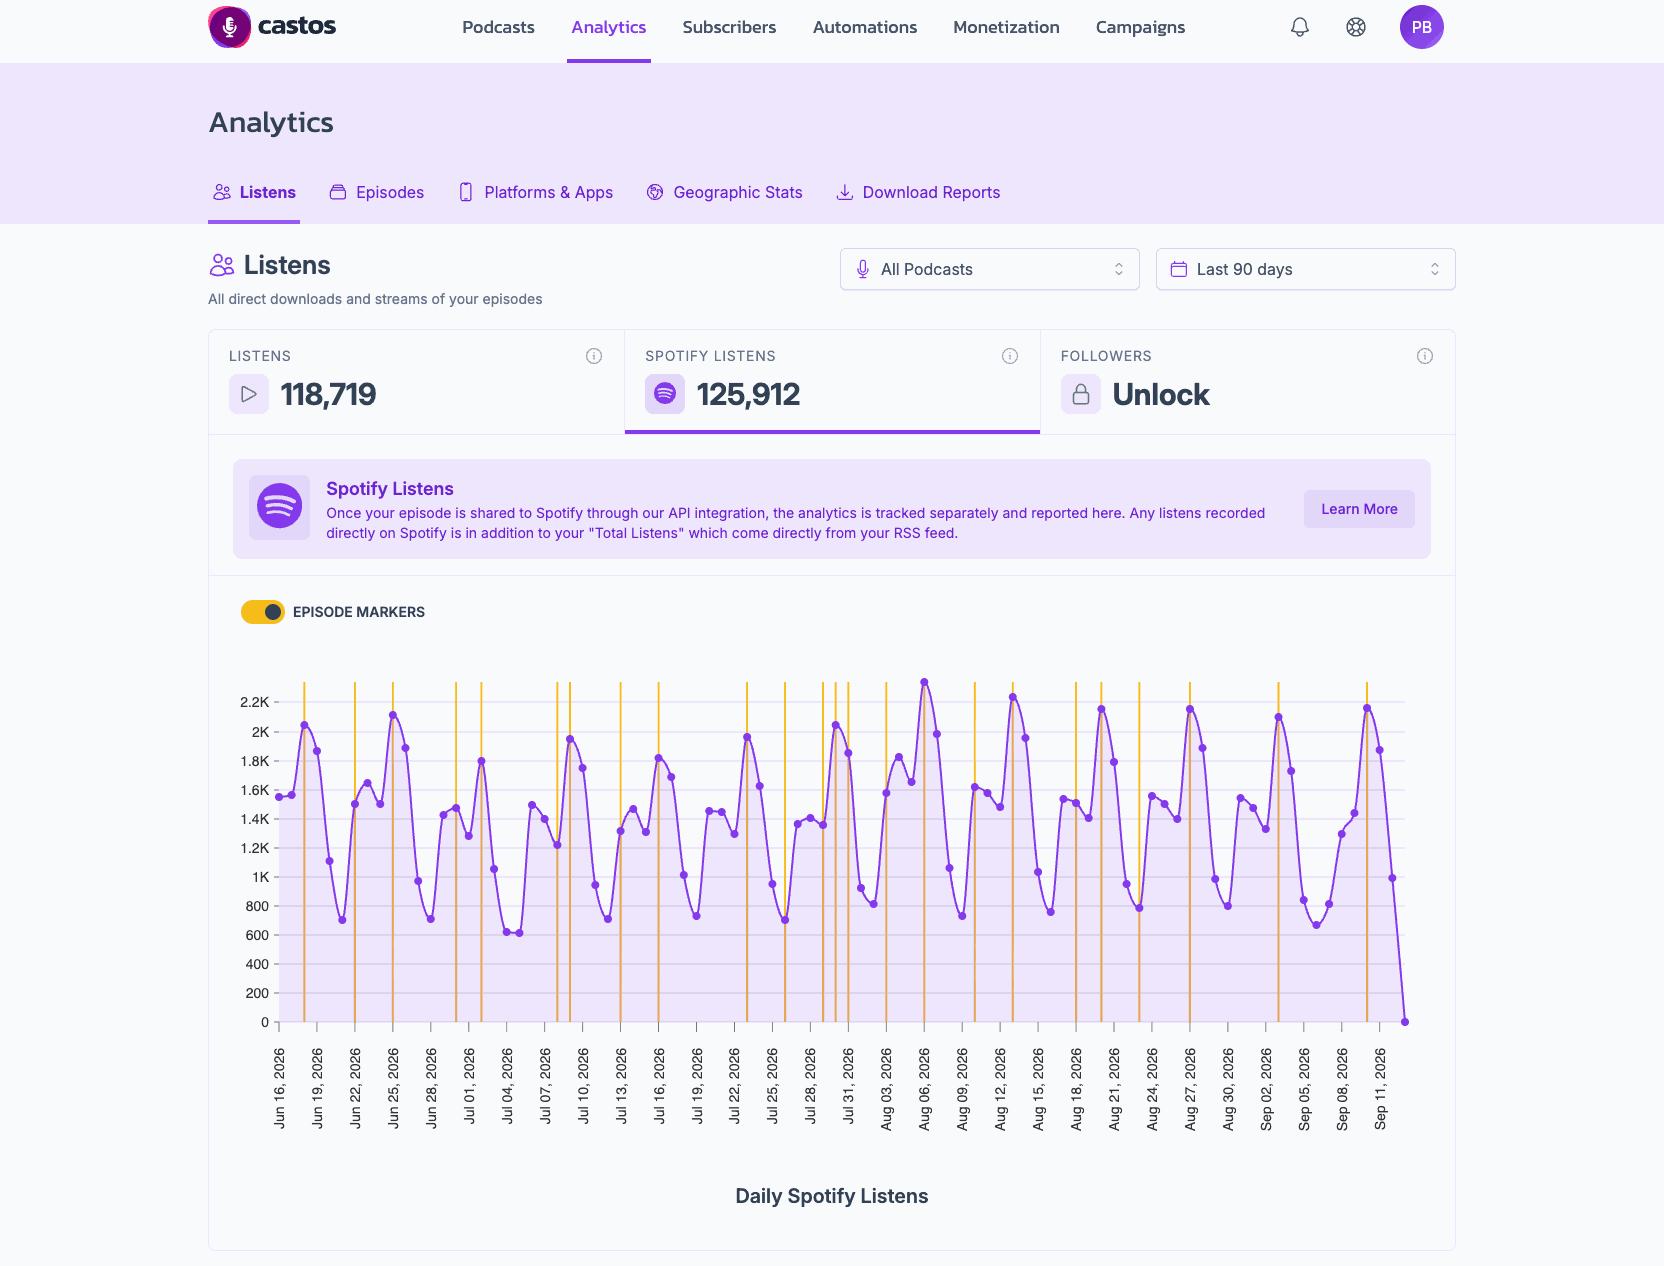
Spotify is a big enough share of most shows’ audience that Castos breaks its numbers out on their own. Click the Spotify Listens card on the Listens tab to see a dedicated trend graph of your daily Spotify listens.
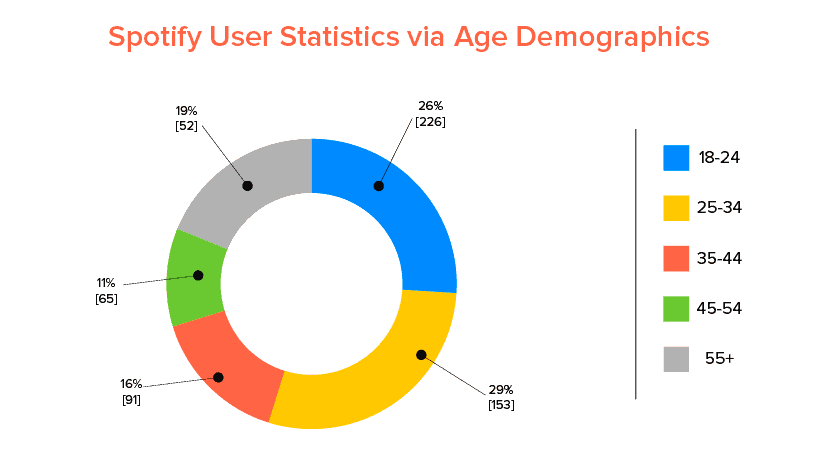
Because Spotify listens are tracked through Castos’s API integration with Spotify rather than through your RSS feed, they’re reported separately from — and in addition to — your main Listens total. It’s important to remember listening platforms have different user demographics; if your podcast caters to an older age bracket, seeing less engagement from Spotify isn’t as alarming because Spotify’s user base skews younger than your ideal listener might be.
Geographic podcast stats
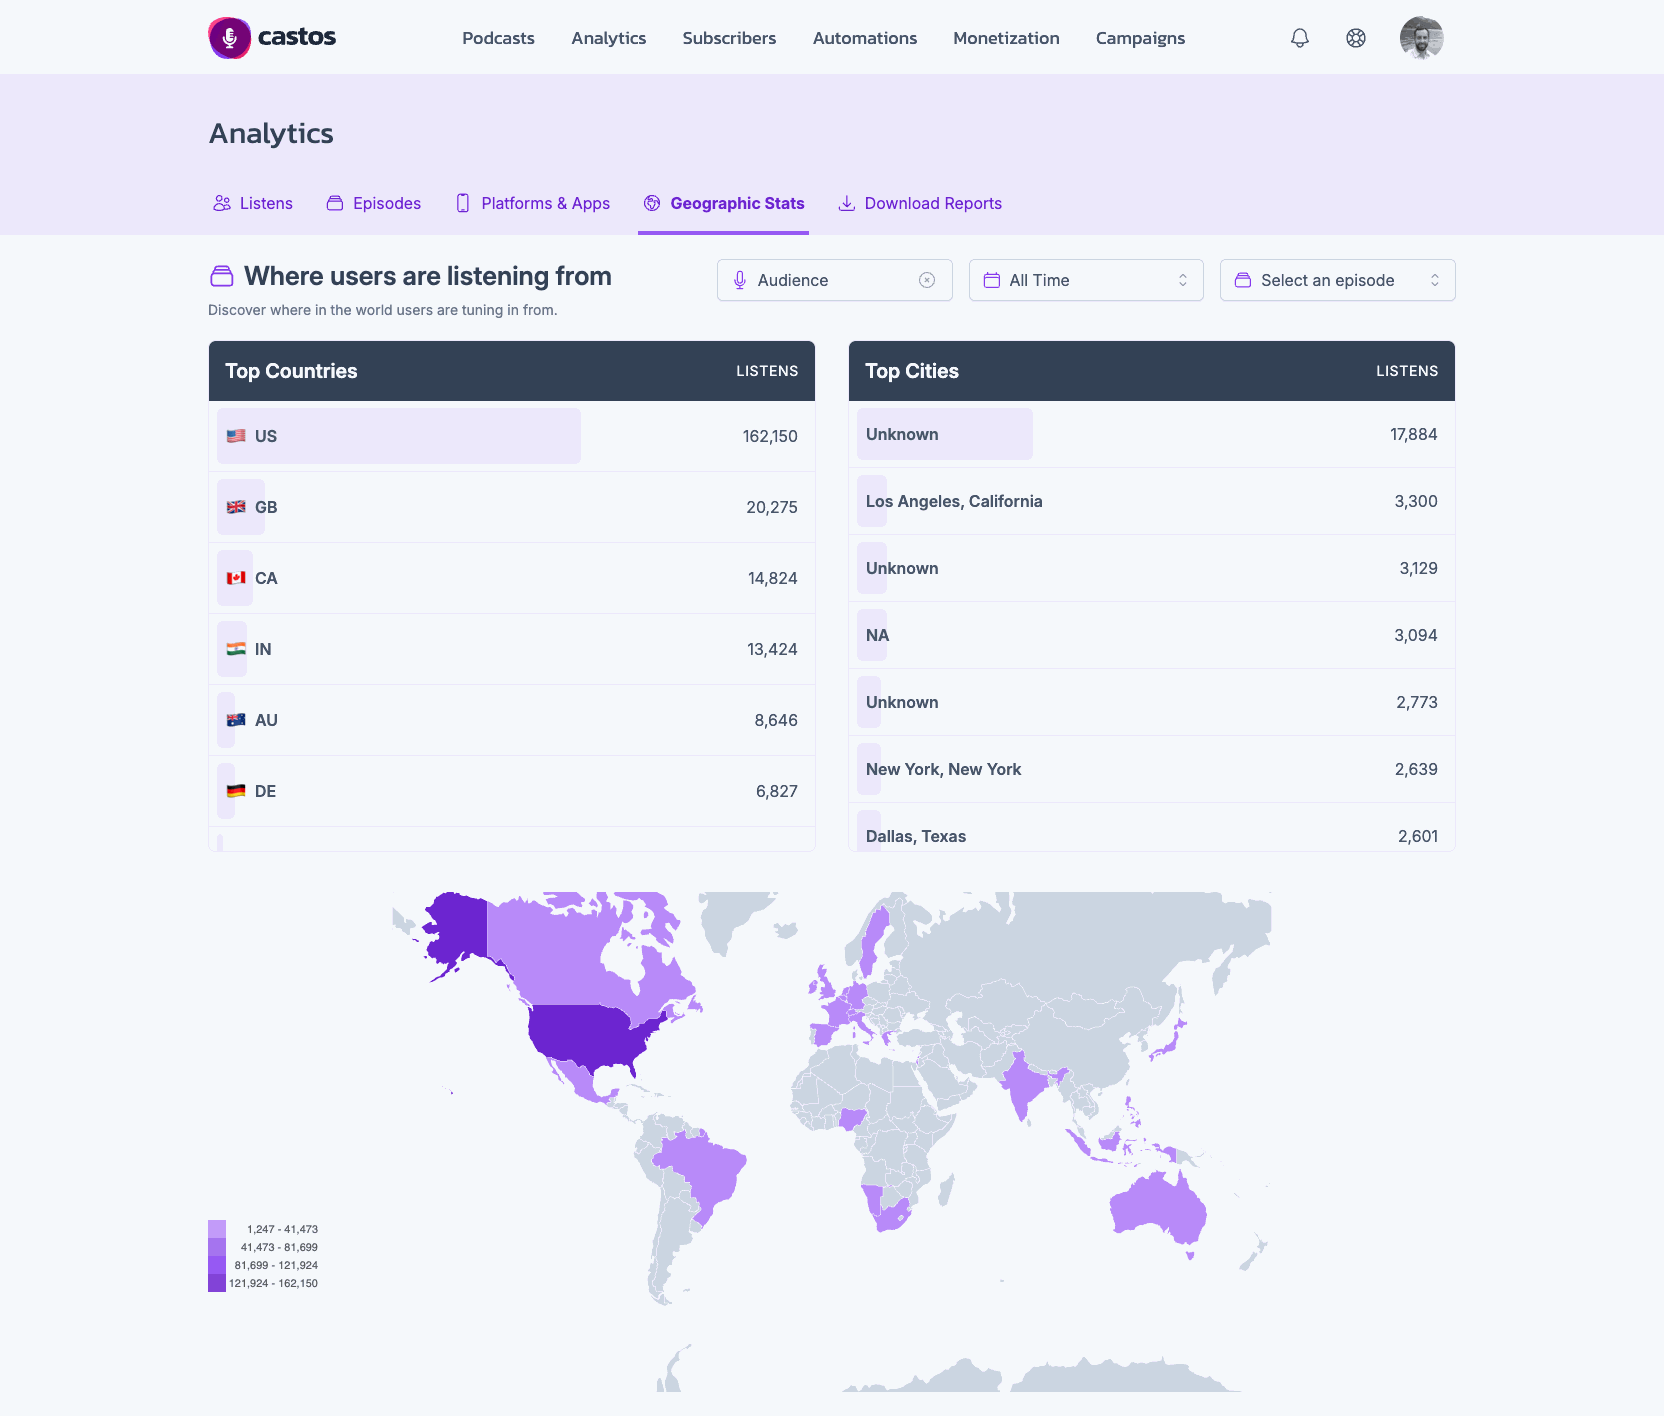
Your podcast’s geographic stats show where in the world listeners are located, broken out into Top Countries and Top Cities tables alongside an interactive map. The data can be filtered by date range and by episode to see how an audience’s geographic breakdown changes over time. Head to the Download Reports tab to export any of your analytics, including geographic data, as a PDF.
Your geographic distribution is an important metric to track, especially when looking at monetization opportunities. If you’re considering hosting live events, start with the cities where the majority of your listeners live. Pitching a local brand for a sponsorship opportunity? Show them how many people in their target cities tune in to your podcast to highlight your value.
Followers
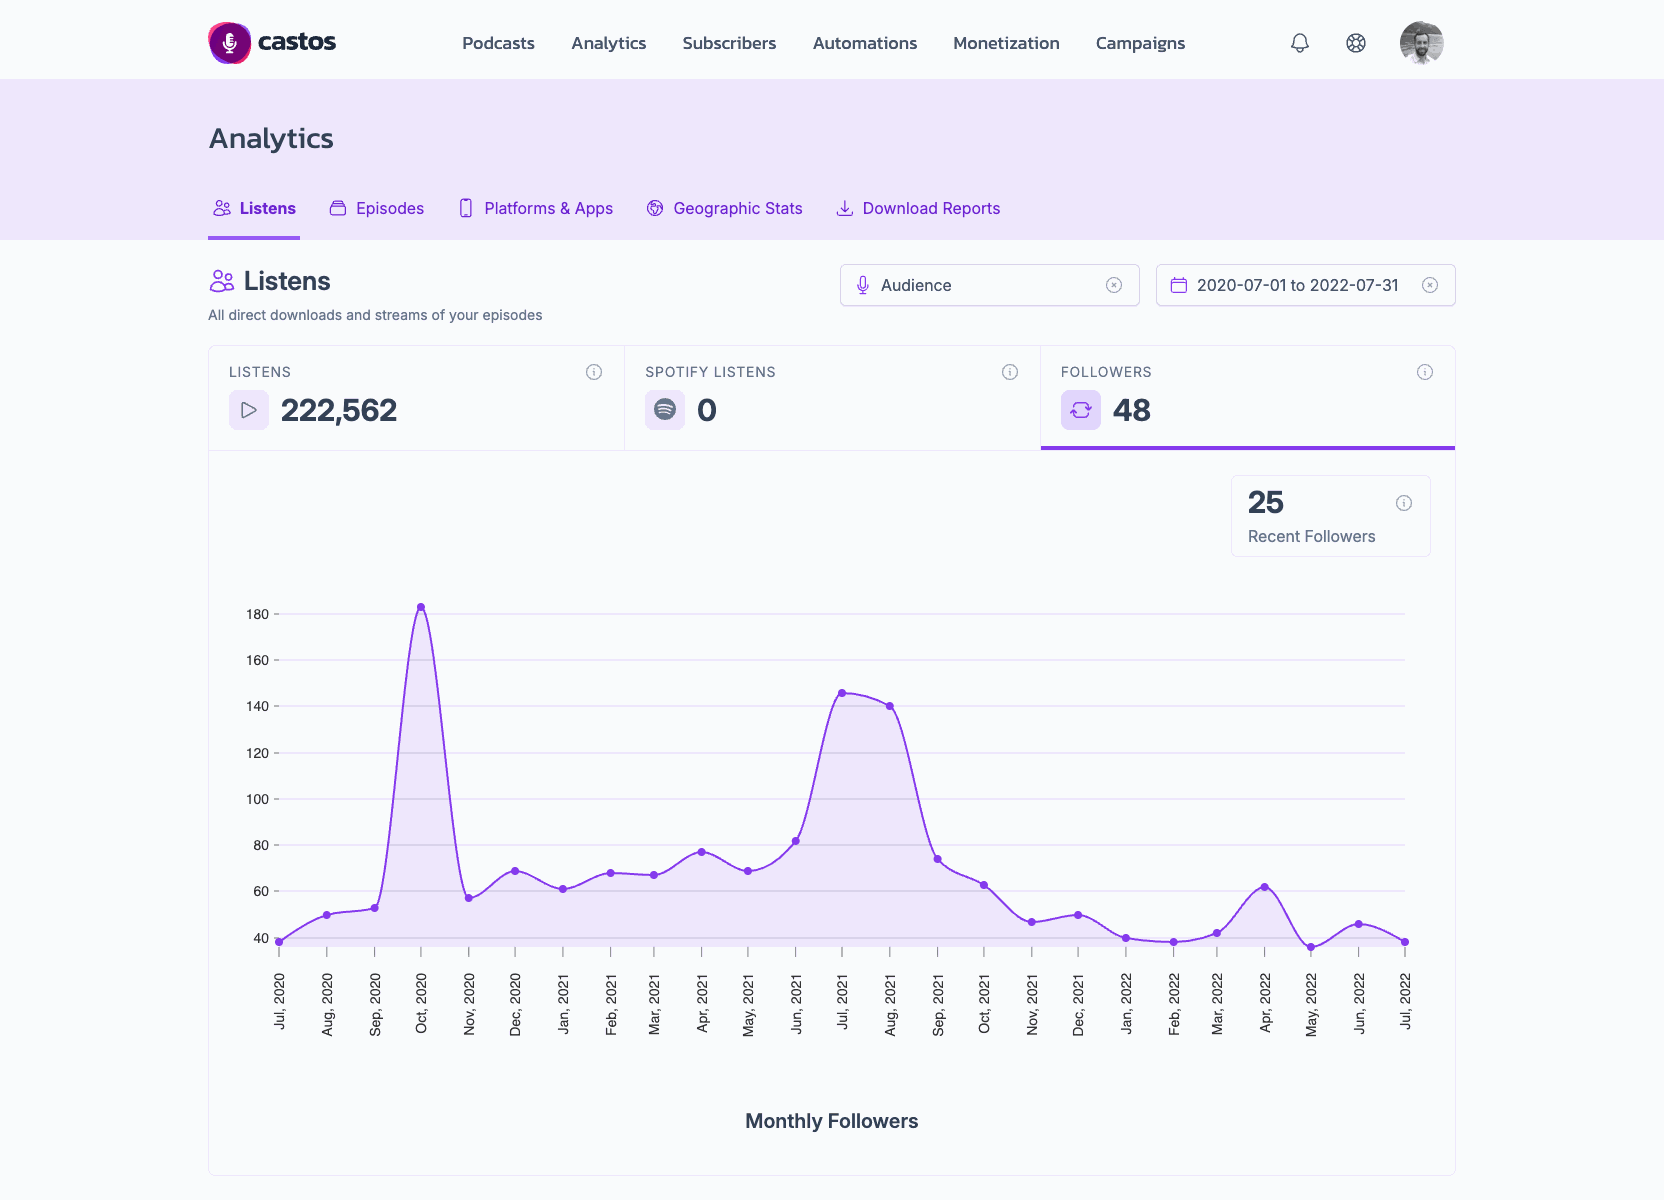
Followers is a proprietary calculation that is unique to Castos. Our algorithm pulls your podcast download stats from every platform and based on their listening behavior, tallies the number of users who subscribed to your show. Click the Followers card on the Listens tab to see your Recent Followers count alongside a monthly Followers trend graph. Use the Followers count to show the number of people who receive automatic updates for each new episode — they’re your active, most loyal supporters.
Followers is available on Growth and Pro plans.
Additional Spotify Podcast Analytics
Spotify provides four main podcast stats about the show overall and lets you drill into an individual episode’s performance:
-
Total Starts: how many times a person pressed play.
-
Total Streams: how many times a person pressed play and played at least 60 seconds.
-
Total Unique Listeners: how many unique listeners pressed play for each episode.
-
Total Followers: how many users clicked the “follow” button on Spotify. For those who subscribe, Spotify automatically downloads new episodes so this number doesn’t accurately reflect how many of your followers played an episode.
-
Individual Episode Performance: drill into each episode by viewing average time users spent listening to it and the percentage of users who listened to 25%, 50%, and +75% of an episode.
Your Castos dashboard highlights your daily Spotify listens under the Spotify Listens card on the Listens tab. But if you notice a lot of activity coming from Spotify, you should review their full dashboard of podcast stats.
How to see additional Spotify podcast stats
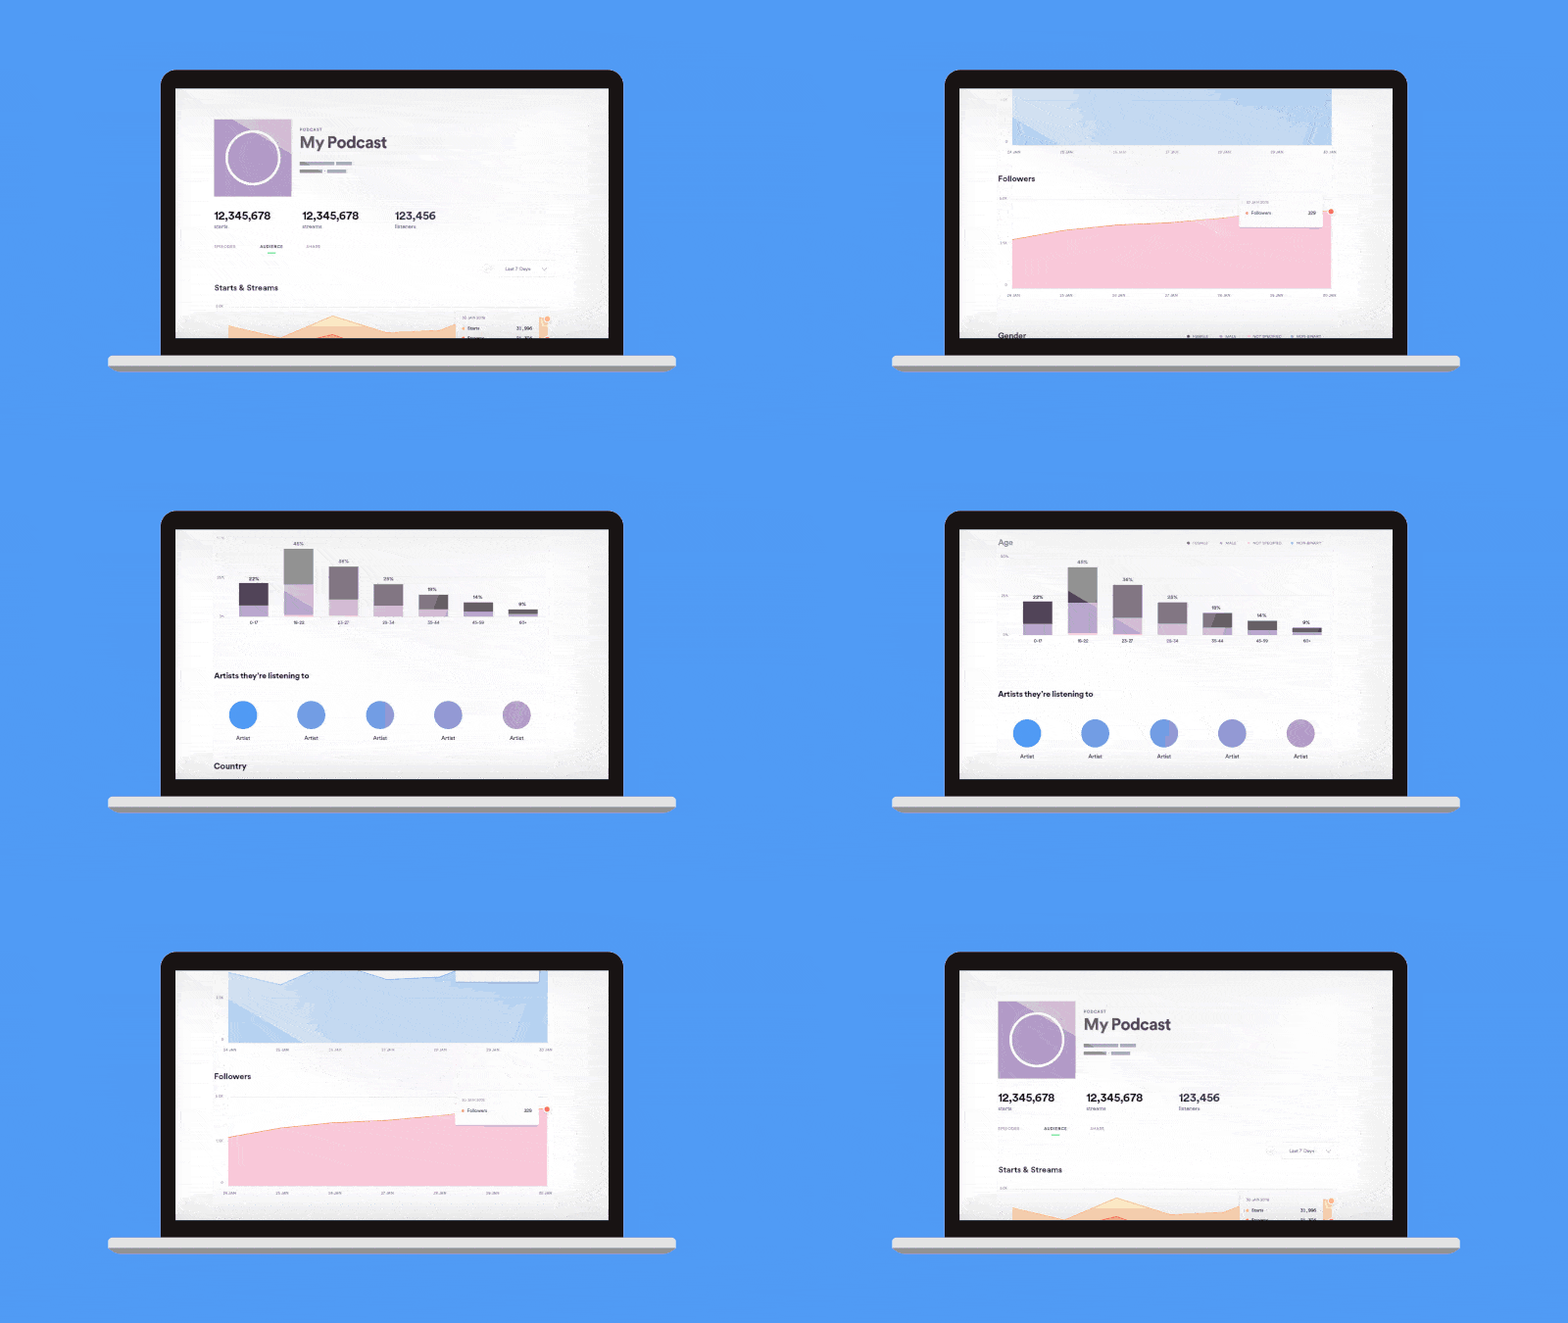
Seeing additional Spotify podcast analytics starts by logging into your Spotify podcast dashboard.
The dashboard’s first screen shows all time Starts, Streams, and Listeners for every podcast you manage. Clicking the “Catalog” tab then shows individual podcast performances. This is where you can drill into specific episode by clicking on each podcast name.
With more information about your audience’s gender and age breakdowns and the average listening time per episode, seeing your Spotify stats paints a fuller picture of your fan base. In partnership with your Castos podcast analytics, podcasters who analyze both data sets are steps ahead of their competition.
Apple Podcast Analytics
Apple Podcast Analytics is a data visualization tool in Podcasts Connect that lets you view actionable insights of your show’s performance and understand how listeners consume your show. You can access this feature from within Podcasts Connect by signing in the same Apple ID you used to originally submit your show and selecting “Podcast Analytics” from the dropdown menu in the top-left corner.
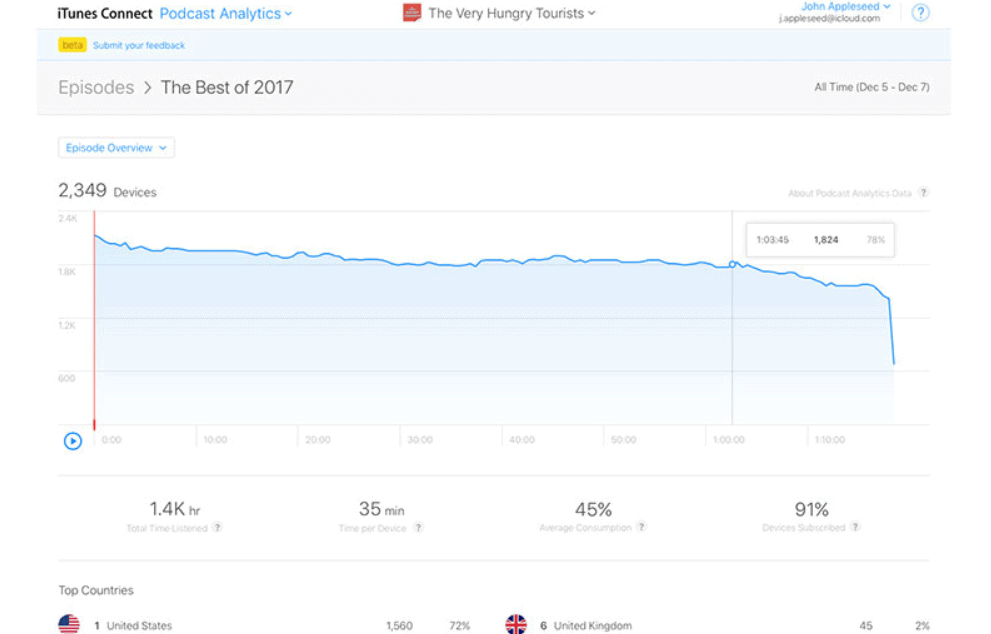
With Podcast Analytics, you can learn a lot about your show and episodes, including…
-
How many people are listening to each episode.
-
Whether people are skipping your intros or ads.
-
Where your listeners are located in the world.
-
Which parts of the episode they find more interesting.
-
How your show and episodes perform over time.
Keep in mind that Apple Podcast Analytics only applies to your show’s performance on Apple Podcasts. This includes iPhone, iPads, Macs, and Apple TVs, so we’re talking about a lot of people, but it won’t include anyone who listens to your show on your podcast website, Spotify, YouTube Music, or other directories and aggregators. If you want a total picture of your show’s performance, you’ll need to view analytics from your podcast hosting service (like we explained above).
To learn more about Apple Podcast Analytics, check out Apple’s introductory video.
Ready to start your own podcast? Learn the nitty-gritty details of starting your own show in our comprehensive guide. Learn how to start a podcast.
Why Your Numbers Won’t Always Match Perfectly Across Platforms
Podcasting doesn’t have a single, central source of truth the way a lot of other media does. Your show lives in dozens of apps and directories, each one collecting and reporting listening activity a little differently, and none of them share raw data with each other. That’s just the nature of an open, decentralized medium — it’s what makes podcasting resilient, but it also means no analytics dashboard, from any host, will ever be perfectly exact.
What you can rely on is a consistent, trustworthy methodology. Hosts that follow the IAB’s podcast measurement guidelines, like Castos, dedupe repeat requests from the same listener and filter out bot and crawler traffic before the numbers hit your dashboard. That’s what makes a download count meaningful instead of just a raw server-log number. Even so, occasional noisy data can slip through any measurement system, and you may see small differences between what your host reports and what Spotify or Apple show for the same episode.
None of this should get in the way of using your analytics. Look at trends over time, compare episodes against each other, and use the geographic and device breakdowns to make real decisions about your show. A single number being a little off from one platform to the next is normal in podcasting; a downward trend across every platform is the thing worth paying attention to.
Summary
Whether you’re podcasting as a passion project or it’s the main focus of your business, understanding the basics of podcast analytics is essential. Many podcast hosting platforms offer different stats and it’s an area of our product that we take very seriously.
Making routine advancements and updates to our analytics reports is a priority at Castos. Our goal is to help our customer create successful podcasts. And it becomes easier to achieve that when you understand who your audience is, where they consume your content, and their listening behaviors.
All you have left to do is sign into your Castos dashboard to find where the best growth opportunities are hiding.
Launch Your Podcast In Minutes
Castos makes launching simple with one-click setup, automatic distribution to all platforms, and professional hosting. No technical skills required.
Start your 14-day free trial