12 Best Podcast Analytics Tools in 2026 (Compared & Ranked)

Your host says the episode got 1,400 downloads. Apple says 900 people pressed play. Spotify shows a third number. None of them are lying. They are counting different things, and once you know which tool counts what, the numbers stop being confusing and start being useful.
We count downloads for tens of thousands of shows every day, which is the only reason this list is worth your time. It also means we are in it. Castos analytics is number one below, we built it, and we built it to do the specific job the free dashboards cannot: pull every channel into one number instead of four.
Short answer: the best podcast analytics tool is the one that aggregates every channel into a single view, and that is your host. Apple, Spotify and YouTube each report beautifully on their own app and are blind to the other two, so a native dashboard can never tell you how the episode did. Your host sits at the audio file, sees every request from every app, and is the only place the full number exists. Add the free dashboards on top for the detail they alone can see, and add a prefix tracker only when an advertiser wants a count that did not come from you.
Key takeaways
- Only your host sees the whole show. Apple, Spotify and YouTube are native to one app each and blind to the rest, so the aggregate number lives with your host and nowhere else.
- Podcast analytics tools come in three types: host dashboards, the free platform dashboards from Apple, Spotify and YouTube, and independent prefix trackers such as Podtrac, OP3 and CoHost.
- Downloads and plays are different metrics, which is the main reason your numbers never match across platforms.
- IAB v2 rules are what make downloads comparable between shows. A download counts once per listener per episode in 24 hours, after 60 seconds of audio has been sent (IAB Tech Lab).
- Compliant and certified are not the same word. Compliant means a host follows the guidelines. Certified means they paid for an annual audit. Most good hosts are compliant and not certified.
- Chartable shut down in December 2024. Any list still recommending it, and several on page one still do, has not been updated since.
- The median episode gets 27 downloads in its first seven days (Buzzsprout, July 2026). Judge your show against that before you judge your tools.
| Tool | Type | Best for | Starts at | IAB v2 stance | Standout metric |
|---|---|---|---|---|---|
| Castos | Host analytics | Sponsor-ready numbers | $19/mo | Compliant, not certified by choice | Followers, a per-episode subscriber count no other host reports |
| Transistor | Host analytics | Running several shows | $19/mo | Compliant, not certified by choice | Episode comparison across time windows |
| Buzzsprout | Host analytics | A first podcast | $15/mo | Complies with v2.2 | Benchmarks your show against everyone else’s |
| Blubrry | Host analytics | WordPress publishers | $7/mo | Says certified compliant | Depth of geography and retention data |
| Simplecast | Host analytics | Teams and networks | $15/mo | No public claim | Unique listener reports built for clients |
| Podbean | Host analytics | Tight budgets | $12/mo | No public claim | Genuinely usable free tier |
| Apple Podcasts Connect | Platform dashboard | Every show, no exceptions | Free | Not applicable | Where people stop listening inside an episode |
| Spotify for Creators | Platform dashboard | Knowing who listens | Free | Not applicable | Age and gender of your audience |
| YouTube Studio | Platform dashboard | Video podcasts | Free | Not applicable | Second by second retention curve |
| Podtrac | Prefix tracker | Selling ads | Free, paid tiers | Holds a v2.0 compliance seal | A place in the industry rankers |
| OP3 | Prefix tracker | Open data | Free | No claim | Public, auditable numbers anyone can check |
| CoHost | Prefix tracker | B2B shows | $89/mo | Says certified compliant | Which companies your listeners work for |
Prices are the cheapest paid tier on each vendor’s own pricing page, checked on 11 August 2026. Ours are on the Castos pricing page. Several are annual-billing prices, so check the monthly rate before you commit.
What we judged these tools on
Four things, in this order, and they come from running podcast measurement as a business rather than from a scoring rubric invented for this page.
Coverage first. A tool that reports on one app is reporting on a fraction of your show. We rank aggregate coverage above every other feature because a number that only counts Apple is not your audience, it is a slice of it.
Whether the number survives contact with a sponsor. We have watched media buyers reject download figures for being raw server counts. A tool earns its place here if its numbers follow the IAB rules, and we say who claims what on that front.
Whether it tells you something you can act on this week. Drop-off changes your intro. Geography changes who you pitch. A vanity chart of downloads by hour changes nothing, and several tools are mostly that.
What it costs when the show grows. Entry prices are marketing. We list the cheapest paid tier and flag where the analytics people actually want sit a tier above it.
Two notes on the table. Prices are each vendor’s own published rate on 11 August 2026, not numbers copied from another roundup, and several of those are annual-billing prices. IAB status is what each company states publicly, because IAB Tech Lab runs the podcast measurement compliance programme without publishing a browsable register of podcast companies. We tell you who is claiming what instead of pretending there is a list to check.
What is a podcast analytics tool?
A podcast analytics tool counts what happens to your episodes after you publish them. That is the whole job. The differences come from where the tool sits.
Your host sits at the file. When any app anywhere asks for your audio, your host sees the request and counts it. That gives you one complete number across every app, which is why your host is your source of truth for reach. It cannot see what happens after the file arrives.
Apple, Spotify and YouTube sit inside their apps. They know when someone pressed play, how long they stayed, and roughly who they are. They only know it for their own users. Apple cannot tell you anything about a Spotify listener.
A prefix tracker sits in front of your file. You add a small piece of text to the front of your media URL and the tracker counts every request before passing it along. That gives you numbers that survive a host change, and numbers an advertiser will accept because they did not come from you.
Here is the same episode, counted three ways. Your host reports 1,400 downloads. Apple reports 340 plays and an average of 22 minutes listened. OP3 reports 1,380 downloads. Nothing is broken. You are looking at total requests, in-app listening behaviour, and an independent count of the same requests.
Native is not the same as complete, and this is the distinction the category gets wrong. Apple’s analytics are native to Apple, which means they are excellent and they stop at the edge of Apple. Same for Spotify, same for YouTube. Four native dashboards give you four partial answers and no total, and the arithmetic to combine them does not exist because they are not counting the same event. Aggregation is the actual product. It is the reason a host dashboard is the centre of this and everything else is a supplement.
If you want the longer version of how to read these numbers once you have them, we wrote what your podcast numbers actually mean as a companion to this page.
The podcast metrics that actually matter
Seven metrics carry almost all the value. The rest is decoration.
Downloads. An app asked for your file. It is the number sponsors quote and the number every host reports. It does not prove anyone listened.
Plays or listens. Someone pressed play. Only the platform dashboards report this properly. If downloads climb while plays stay flat, you are being subscribed to and ignored, which is a content problem rather than a marketing one.
Unique listeners. How many individual people, rather than how many requests. One person listening on a phone and a laptop is two downloads and one listener. This is the honest audience-size number, and we explain the counting rules in unique listeners.
Consumption or completion rate. What share of the episode the average listener finished. Below about 60 percent, look at your intro. Sponsors increasingly ask for this before they ask for downloads.
Drop-off. The exact minute people leave. Apple gives you this per episode and it is the single most actionable chart in podcasting. If half your audience leaves at 2:40, listen to your own episode at 2:30 and you will usually hear why.
Followers or subscribers. People who get new episodes automatically. Slow moving, and the best early signal of whether a show is compounding. Castos reports this as Followers, which is our own calculation rather than an industry standard.
Geography, apps and devices. Where people listen and what they listen on. It matters for two decisions: what time you publish, and whether a sponsor’s market matches your audience. We break the geography side down in where your listeners are.
One benchmark, so you have something to measure against. Buzzsprout publishes rolling data from every show on its platform. As of July 2026, the median episode gets 27 downloads in its first seven days. 97 gets you into the top 25 percent, 409 into the top 10 percent, and 4,579 into the top 1 percent. Most people asking whether their numbers are bad are somewhere around the median and doing fine.
Why your podcast numbers never match
This is the question behind most support tickets about analytics, and it has a boring, specific answer.
The IAB Tech Lab wrote the rules. The Podcast Measurement Technical Guidelines define a download as one request, per unique IP address and user agent combination, in a 24 hour window, after at least 60 seconds of audio has been sent. Bots, data centres and directory crawlers get filtered out.
That is why your raw server logs are always higher. A feed indexer hitting your file forty times is forty log lines and zero downloads. A host that reports the log number is not being generous, it is being wrong.
Certified and compliant mean different things. Compliant means a company built its counting to the guidelines. Certified means it paid for an annual independent audit. Transistor is refreshingly direct about this in its own help documentation, saying it follows the guidelines but does not pay for the annual certification (Transistor). Castos analytics are IAB v2 compliant, and we do not claim certification either.
Platform numbers are a different species entirely. Apple and Spotify are not trying to report IAB downloads. They report what happened in their app. Comparing an Apple play count to a host download count is comparing two accurate answers to two different questions.
For the deeper version, including what changed between guideline versions, see how IAB measurement works. It is also the section to read before pitching sponsors, because the first thing a media buyer asks is which standard your numbers follow.
The 12 best podcast analytics tools
Analytics built into your podcast host
This is where most people should start, because you already pay for it.
1. Castos
$19/month. We make this one. We also built it around the aggregation problem above, so here is what that means in practice.
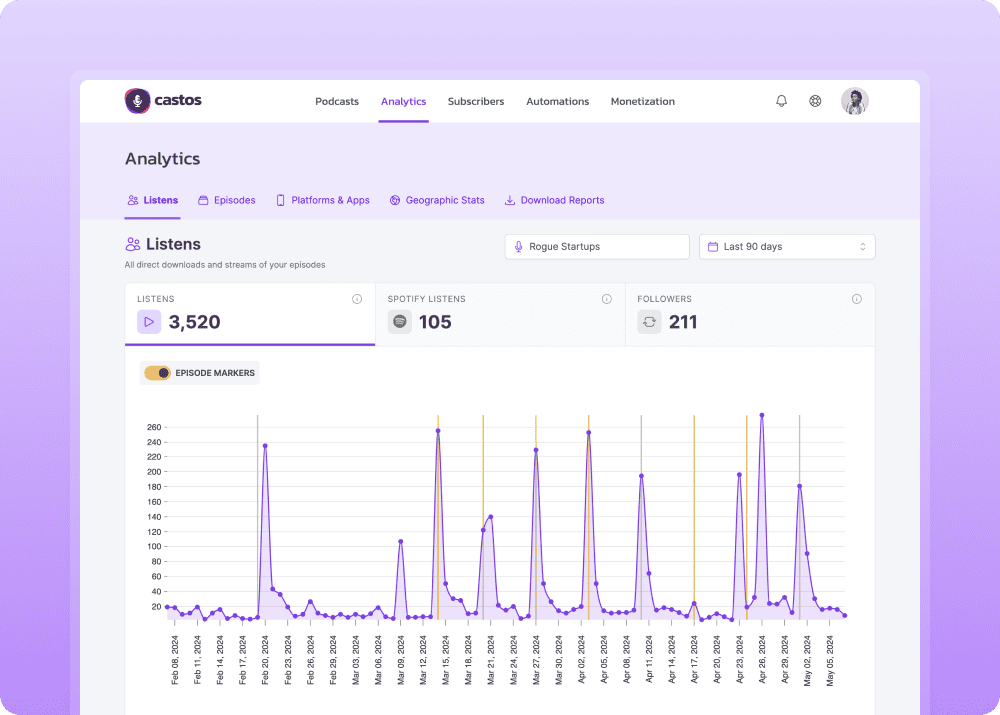
Castos reports IAB v2 compliant downloads and listens per show and per episode, unique listeners, Followers, location by country and city, and the apps, browsers and devices people use. The Listening Methods report pulls Apple, Spotify, browsers and third-party apps into one place, with Spotify listens broken out on their own tab, so the channel comparison happens in the dashboard instead of in a spreadsheet you maintain by hand on a Monday. Reports export as a file you can send a sponsor. Everything is tracked from the moment you publish, with no tags or scripts to install.
The claim we will actually defend: what the dashboard says is what we count, measured to the IAB rules, with the counting method written down rather than implied. If a number in Castos does not match a number somewhere else, we can tell you exactly which of the two definitions moved.
Where it fits. Shows that need numbers a sponsor will accept, and businesses running private or internal podcasts where the audience is small and every listener matters. It also pairs with episode transcripts and dynamic ad insertion in the same account, so ad campaign reporting is not a separate tool.
The honest limitation. We do not show in-episode drop-off. No host can, because the file leaves our server in one piece. For that you need Apple.
2. Transistor
$19/month. Analytics that make sense when you run more than one show, with episode comparison across matching time windows so a Tuesday episode is measured against another Tuesday episode.
Every plan includes multiple podcasts, which is why networks and agencies like it. Their public position on IAB compliance is the clearest in the industry, and they explain what a download is in language a client can follow.
The honest limitation. Analytics are deliberately simple. If you want segmentation, this is not it.
3. Buzzsprout
$15/month, with a free tier that keeps episodes for 90 days. Buzzsprout states its statistics comply with IAB Podcast Measurement Technical Guidelines 2.2, which is the most current version any host on this list names.
The standout is benchmarking. Buzzsprout publishes what an average episode does across its whole platform, so you can see where your show sits instead of guessing. That data is the source of the 27 download median above, and it is a genuine public service.
The honest limitation. Analytics get shallow once a show grows past a few thousand downloads an episode.
4. Blubrry
$7/month for the entry plan, with statistics included on every tier. Blubrry says its statistics are certified compliant by the IAB, and it has been in podcast measurement longer than almost anyone.
The depth of geography and retention reporting is the reason to choose it, along with PowerPress if you publish through WordPress. If that is your setup, our own WordPress podcast plugin is the alternative worth comparing it against.
The honest limitation. The interface shows its age, and plan tiers are structured around storage in a way that takes a minute to decode.
5. Simplecast
$15/month for Basic, though the analytics people actually want are on Essential at $35/month, which adds unique listener reports, location down to region, and technology breakdowns.
Built for teams. If you produce shows for clients, the reporting is designed for handing over rather than screenshotting.
The honest limitation. The good analytics are a tier up, so the real price is $35/month, and there is no public IAB compliance claim on the pricing page.
6. Podbean
$12/month billed annually, $17 monthly, with a free plan that is genuinely usable. Advanced stats cover listener locations, devices, sources and trends, and network-level roll-ups are available on higher plans.
The honest limitation. No public IAB compliance statement we could find, which matters the moment you sell an ad.
Comparing hosts more broadly? We keep a full podcast hosting platforms compared roundup that covers migration, monetisation and support alongside the analytics.
Free platform dashboards you should already be using
These are free, and no paid tool replicates them. Skipping them is the most common analytics mistake I see. Read them as depth on one channel each, never as a picture of the show, and never try to add them together.
7. Apple Podcasts Connect
Free. Followers, plays, and the drop-off chart. Apple shows you where inside an episode people stopped, which no host and no prefix tracker can see.
If you do one thing after reading this page, open Apple’s dashboard and look at the retention curve on your last five episodes. It usually explains more than a month of download charts.
The limitation. Apple listeners only, and the interface is sparse.
8. Spotify for Creators
Free. Age and gender breakdowns, episode performance, and audience segments. This is the only free source of real demographic data, and it is what sponsors mean when they ask who your audience is.
The limitation. Spotify listeners only, and the numbers will never match your host.
9. YouTube Studio
Free. If you publish video podcasts, the retention graph is second by second and brutally clear about which segments lose people.
The limitation. Built for video generally, so podcast-specific views are thin.
One correction while we are here, because it is on half the lists still ranking for this term. Google Podcasts Manager no longer exists. Google retired the app and its analytics moved to YouTube Music. Any 2026 roundup still listing it as an option was not rewritten this year.
Independent prefix trackers
A prefix is a short piece of text you put in front of your media URL. Every request passes through the tracker first, gets counted, then continues to your file.
Two things to know before you add one. The numbers survive a host change, which is the main reason to bother. And if the service dies, the prefix breaks, which is exactly what happened to more than 20,000 shows in December 2024.
10. Podtrac
Free to start, with paid publisher plans. The oldest independent measurement service in podcasting, and the one behind the industry rankers advertisers read. Podtrac announced an IAB Tech Lab compliance seal for version 2.0 of the guidelines.
Best for shows selling ads that need a number an agency already trusts.
The limitation. The interface feels like it was built for media companies, because it was.
11. OP3
Free and open source. OP3 is an independent prefix service built by John Spurlock, funded by sponsors, with the whole codebase public. No signup, no account.
The catch is also the point. Your stats are public by default. Anyone can look up your show. For an indie podcaster arguing for open data that is a feature. For a brand show it is a non-starter.
Best for podcasters who want a second opinion on their host’s numbers and do not mind who sees it.
12. CoHost
$89/month on the Pro plan, billed annually, per show. CoHost tracks downloads and unique listeners like the others, then adds the thing nobody else does: it identifies which companies your listeners work for.
Best for B2B shows where 400 downloads from the right twelve accounts is worth more than 40,000 from nobody in particular.
The limitation. The price only makes sense if the show exists to sell something specific.
What happened to Chartable?
Chartable was the default recommendation on every list like this one until Spotify, which had bought it in 2021, announced on 27 September 2024 that it was closing the service. It switched off in December 2024, with SmartLinks and SmartPromos folded into Megaphone (Podnews).
The part that caught people out was the prefix. Days before the switch-off, Chartable’s prefix was still sitting in the RSS feeds of more than 21,000 shows (Podnews), and a dead prefix in front of your audio file is a broken URL. Podcasters who did not strip it out found episodes that would not play.
Two lessons stuck. Check your feed for prefixes you no longer use. And treat any measurement tool you do not control as something that can disappear, which is a decent argument for keeping your host as your source of truth.
How to choose the best podcast analytics tool for your show
Skip the feature grid. Pick by stage.
A new show, under a year old. Your host’s analytics plus Apple and Spotify. That is it. Do not pay for anything else and do not check daily, because episode numbers are noisy for the first month and you will read weather as climate.
A growing show taking sponsorship. Make sure your host is IAB compliant, then add one prefix tracker for independent numbers. Podtrac if you want the rankers, OP3 if you want it free and do not mind it being public. Start reporting consumption rate alongside downloads, because that is where buyer expectations are heading, and read up on podcast monetization tools before you set a rate.
A branded or B2B show. Company-level data earns its price here in a way it never does for a hobby show. CoHost, or your own attribution through tracked links if the budget is not there.
A network or agency. Host analytics that report per client without exporting to a spreadsheet, plus one consistent prefix across every show so the numbers are comparable.
The rule underneath all of it: never pay twice for the same measurement. If two tools on your list count downloads and neither adds something the other cannot see, cancel one and put the money into growing the numbers you are tracking.
FAQs about podcast analytics tools
What is the best podcast analytics tool?
Your podcast host’s analytics, because it is the only tool that counts every listen across every app rather than one app at a time. Apple and Spotify add depth inside their own platforms and are worth checking weekly. Shows selling ads add an independent prefix tracker on top.
What is the best free podcast analytics tool?
Apple Podcasts Connect and Spotify for Creators, because they report in-episode drop-off and demographics no host can see. OP3 is the best free independent tracker, as long as you are comfortable with your download numbers being public.
How do I measure podcast performance?
Track downloads for reach, unique listeners for audience size, and consumption or drop-off for whether people finish. Compare episodes over the same window, normally seven days, because an episode published last night is not comparable to one published last month.
Why do my podcast downloads differ between platforms?
They count different events. Your host counts file requests across every app. Apple and Spotify count plays inside their own apps only. IAB v2 rules then filter bots and de-duplicate repeat downloads within 24 hours, so the compliant number is always lower than a raw server log.
What is a good number of downloads per episode?
The median episode gets 27 downloads in its first seven days, according to Buzzsprout’s July 2026 platform data. 97 puts you in the top 25 percent, 409 in the top 10 percent, and 4,579 in the top 1 percent.
Do I need a podcast analytics tool if my host already has stats?
Usually not. Your host plus the free platform dashboards covers most shows. Add a paid tool only for something specific your host cannot do, such as third-party verified numbers for advertisers or company-level data for a B2B show.
Where to start
Open Apple Podcasts Connect tonight and look at the drop-off chart on your last five episodes. It is free and it will tell you more than any tool you could buy this week. And if the numbers say discovery is your problem, the fix is usually SEO for podcasts rather than another dashboard.
Then, if your host’s numbers are not giving you unique listeners, location and sponsor-ready reports in one place, have a look at the analytics dashboard we built.
Launch Your Podcast In Minutes
Castos makes launching simple with one-click setup, automatic distribution to all platforms, and professional hosting. No technical skills required.
Start your 14-day free trial